Sample report: the result of a sale-day rehearsal
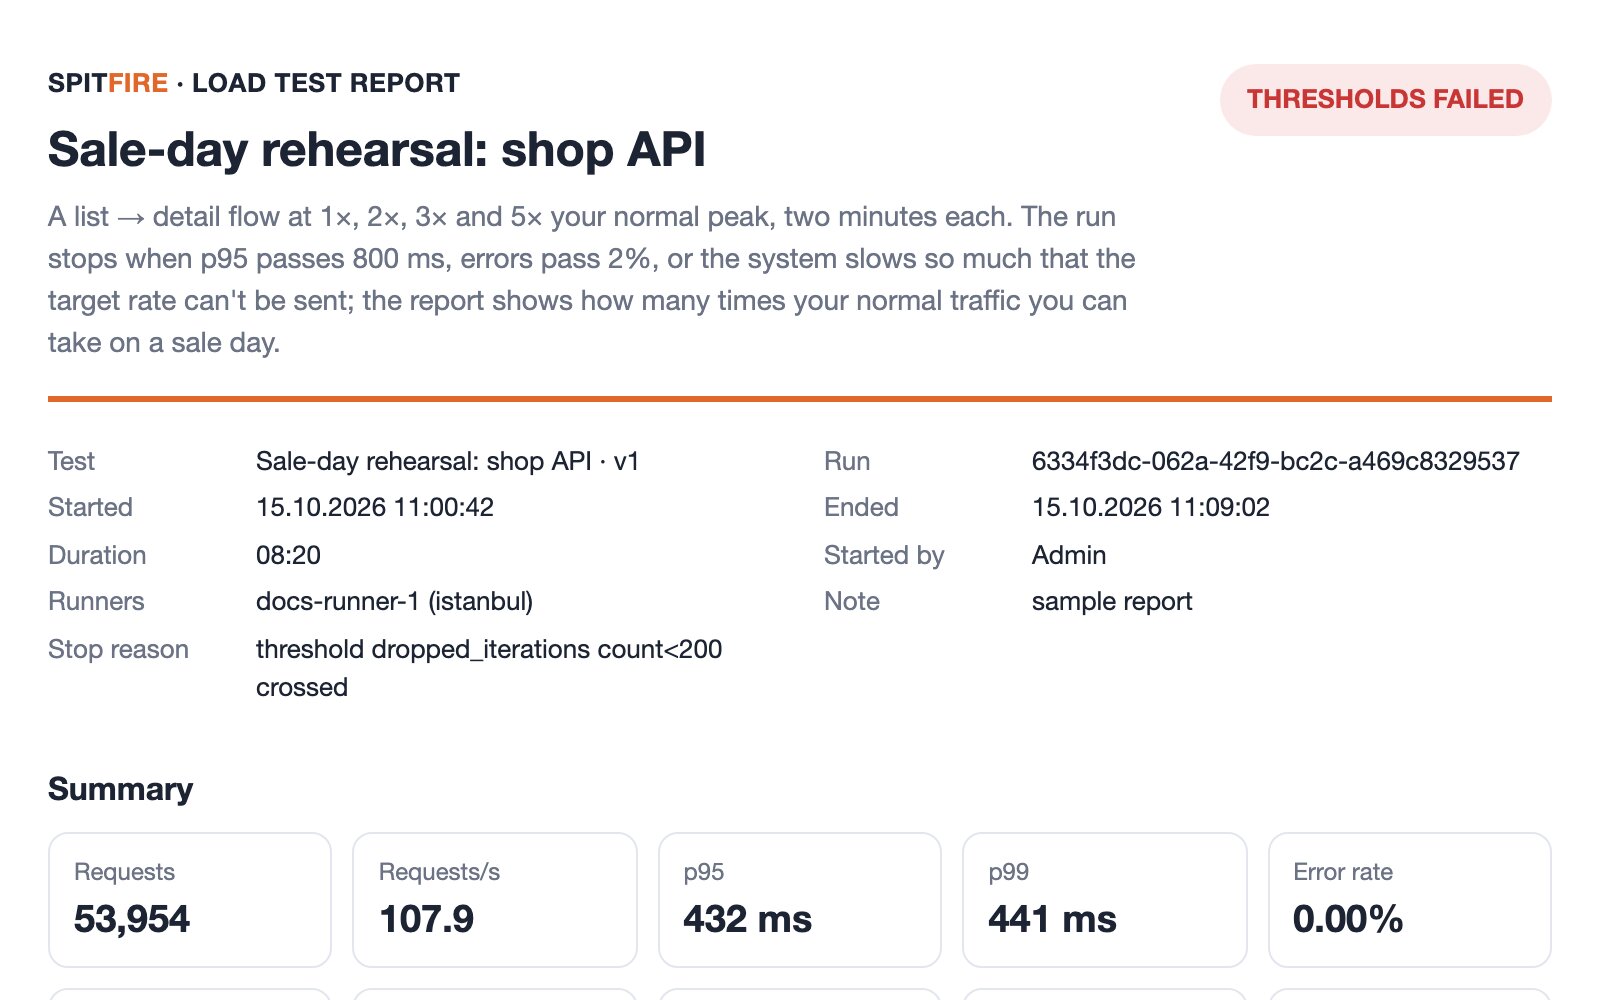
See what you get at the end of a run without installing Spitfire. This is the product's own report, unchanged: the Sale-day rehearsal template, run against a demo service that holds up to about 230 requests per second, taking a normal peak of 25 visits per second.
Open the full reportDownload the PDF
The result: held at 3× normal, not at 5×
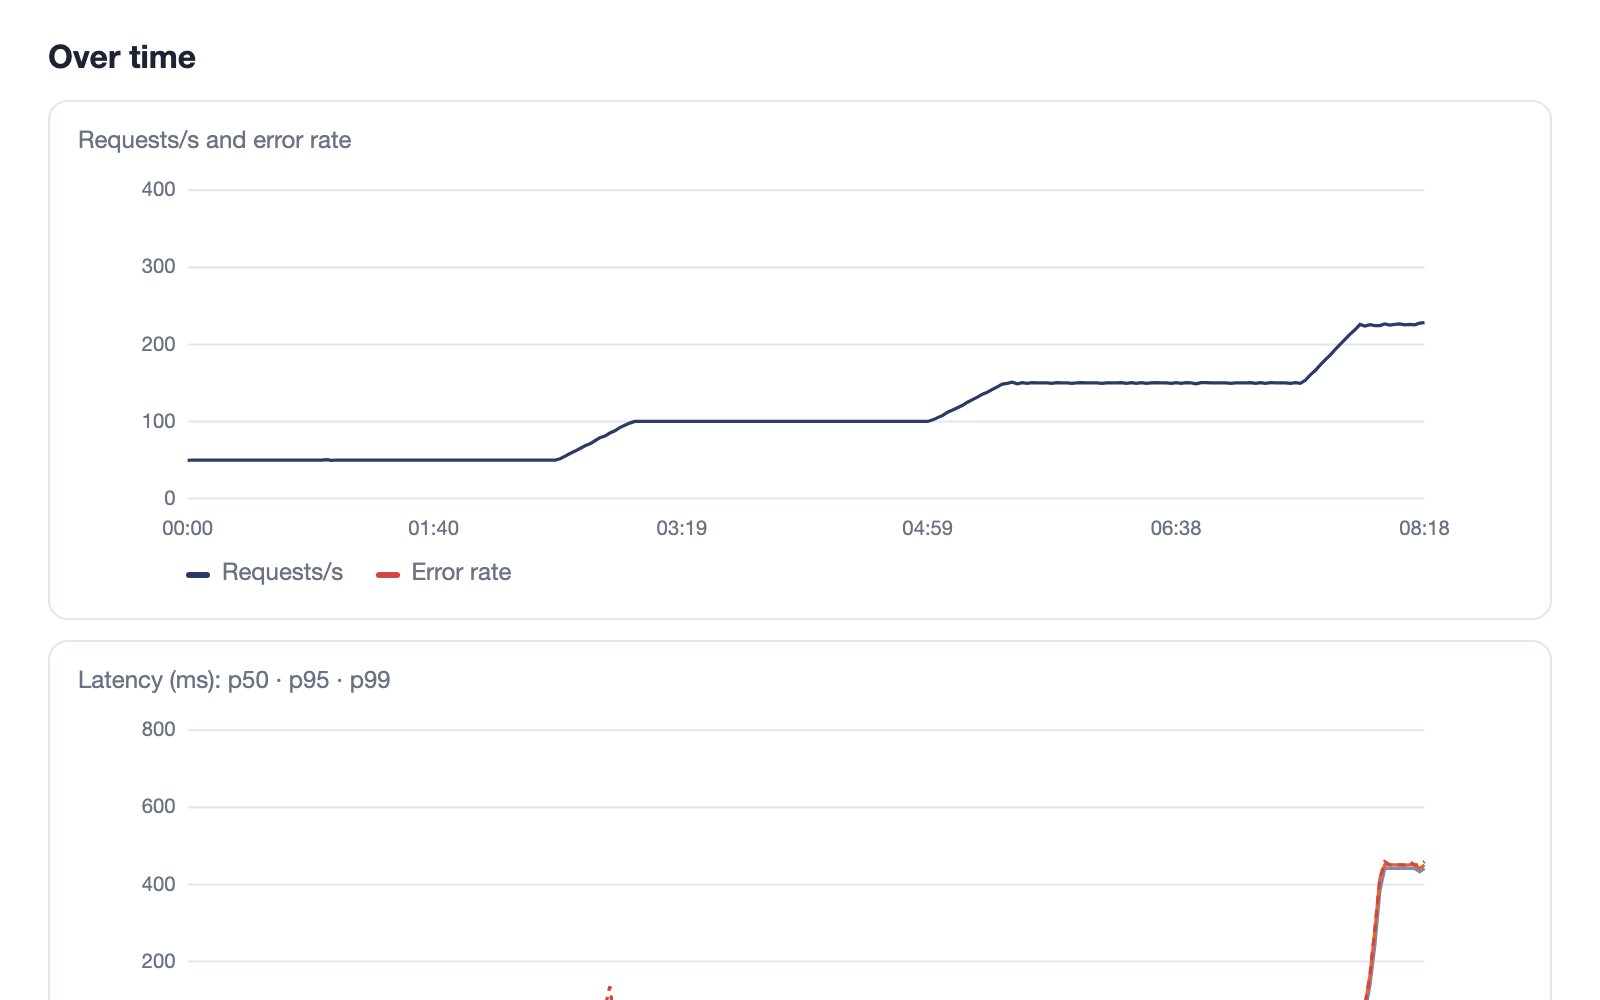
The service took 3 times normal (75 visits, 150 requests per second) without errors and at low latency; it did not take 5 times. Climbing to 5× it saturated at about 228 requests per second: requests started to queue, p95 jumped from a few tens of milliseconds to 430 ms and 100 virtual users could no longer send the target rate. Once more than 200 iterations could not start, the run stopped by itself in its 8th minute. The error rate stayed at zero: this system does not fail when it breaks, it slows down. For the sale, that reads: don't count on more than three times normal without adding capacity.
What the report holds
- Verdict and thresholds. Whether the run passed, why it stopped if it did, and each threshold with its observed value.
- Charts over time. Requests per second and error rate, p50, p95 and p99 latency and virtual users; as the load climbs stage by stage you see where latency breaks away.
- Step table. Requests, requests per second, error rate, average, p50, p90, p95, p99 and maximum for each step.
- Locations, status codes and checks. A breakdown by location when load came from several places, the spread of HTTP codes and each check's pass rate. The product's run page adds findings and what to do next; for example a breakpoint test for the exact number.
The report is a single HTML file with no scripts; you can e-mail it or keep it in an archive. The same report comes as a PDF too, the raw results as CSV (step summary or second by second), and you can show it to someone without an account through a share link valid for 1 to 90 days. With your systems' OpenTelemetry or Prometheus data connected, the run page shows your services' own measurements next to the load stages (OpenTelemetry root cause).
The same on your own system
After installing, go to Tests → From a template → Sale-day rehearsal and enter your address and normal traffic; minutes later you have this report for your own system. How to plan the rehearsal: Black Friday load testing.
Spitfire installs on Docker or Kubernetes with one command; every testing feature and protocol is open in the free edition.