Where does your system break?Self-hosted, on-premise load testing and performance testing
Find it before your customers do. Spitfire raises the load step by step, shows where latency starts to bend, and marks the run as failed the moment a threshold breaks. Tests are built in the browser, no code needed. It compares your new release with the old one under load at the same time, and tells you before you go live.
Version comparison: the old and the new release at the same time, with the same load, and a plain verdict at the end →curl -fsSL https://spitfire.tr/install.sh | bash -s -- dockerone command: Docker is all you needFill in a test like a form.
Scenario, stages, steps and thresholds on one screen. Behind it the same test is kept as JSON, so you can also write it as a file.
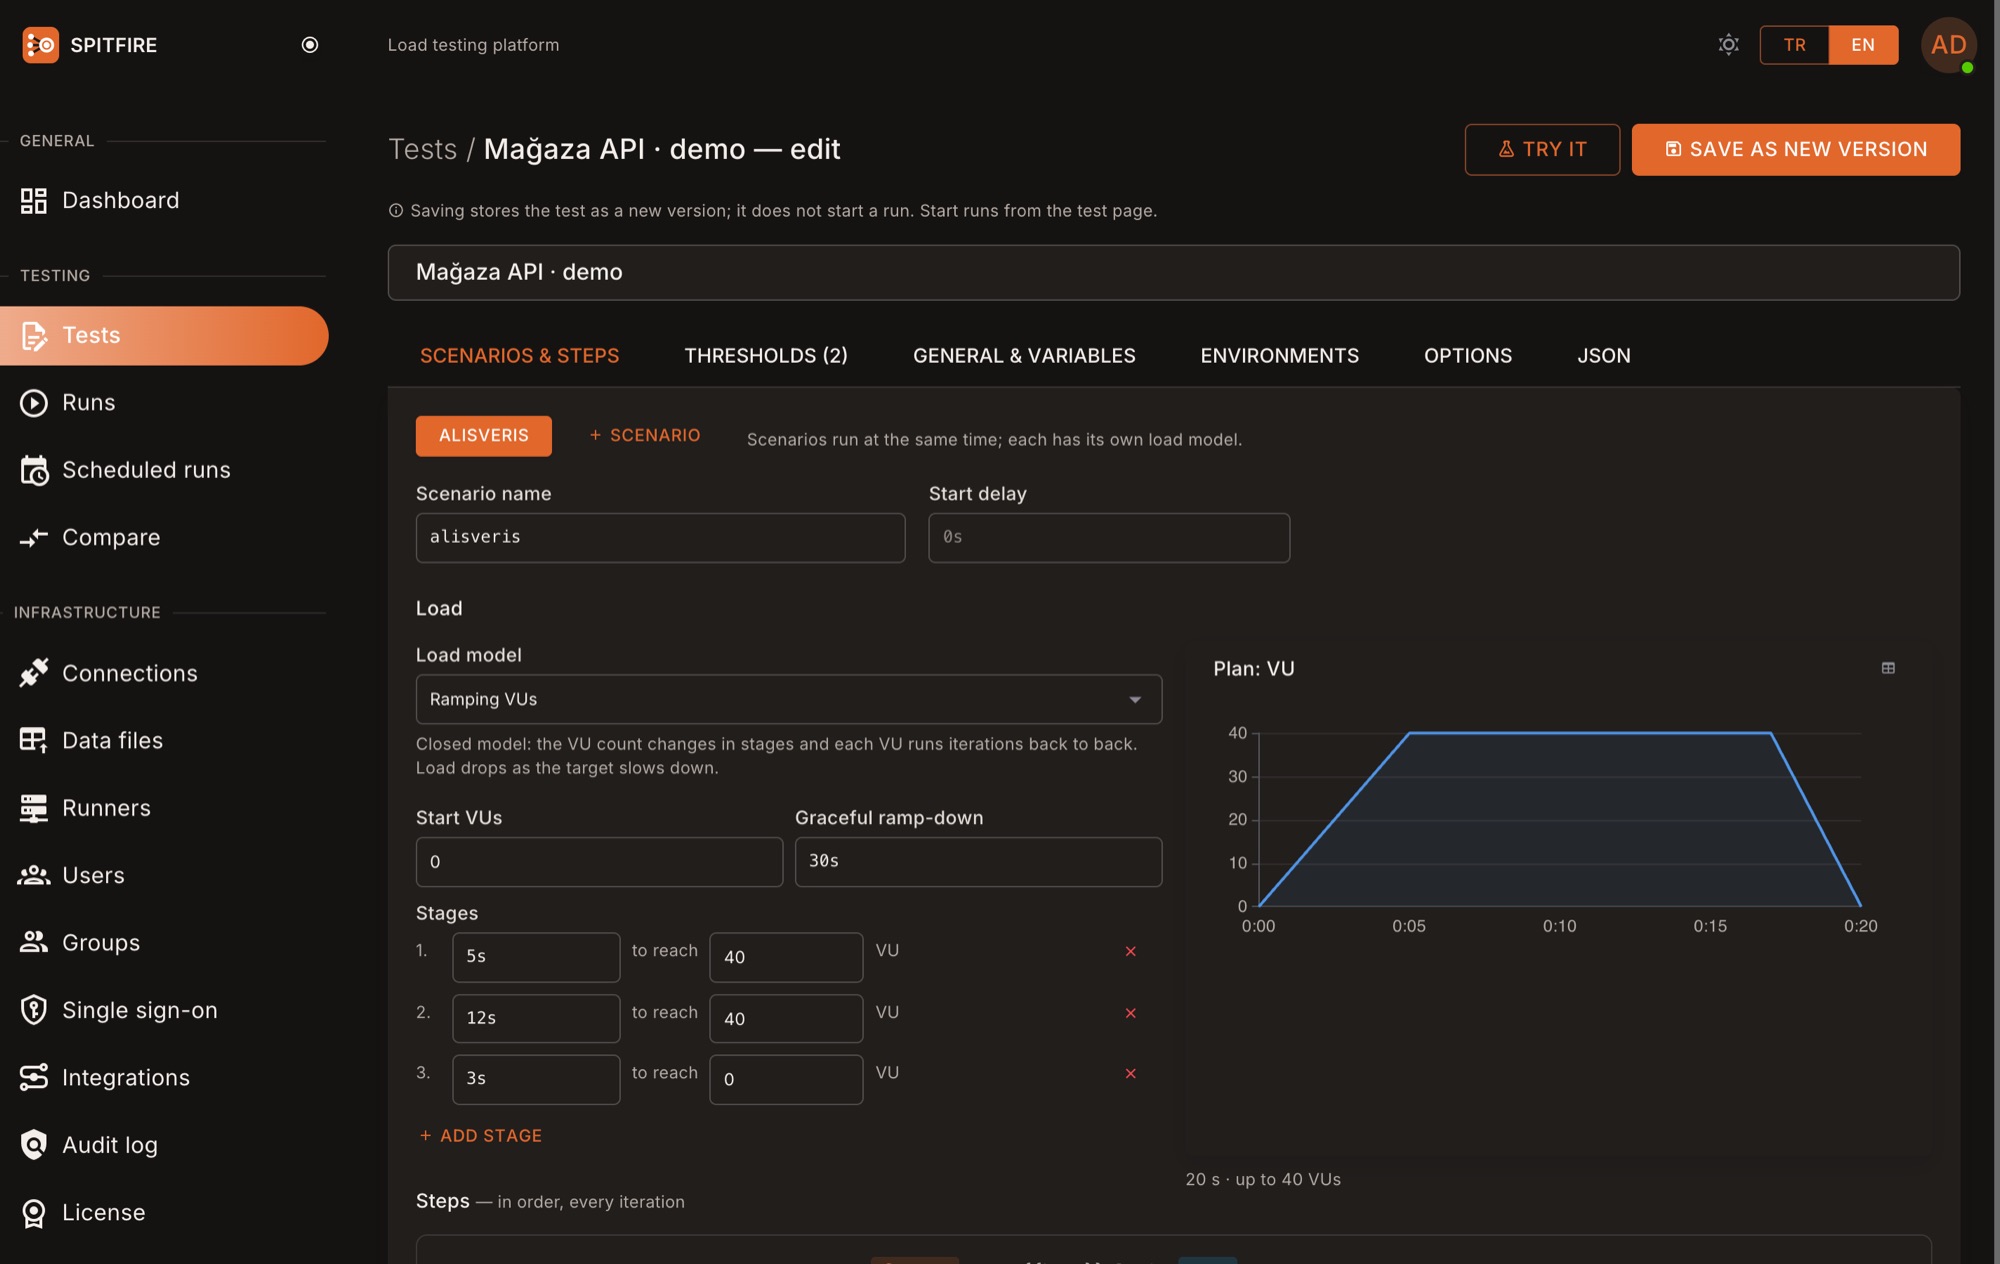
Scenario, load model and stages, with the plan drawn on the right. Steps, thresholds, environments and JSON on the same screen. Real screenshot, dark theme.
What's new in the recent releases?
Web Vitals with real browsers, new protocols and enterprise identity management. Each one arrives with an update of your installed Spitfire.
From test to verdict.
A user journey built without scripting, a run split across locations, live p95 and errors, the findings after the run, and two releases compared under the same load.
Is the new release slower? Find out before it goes live.
Run the same test, with the same load, at the same time, against the environment running the old release and the one running the new release. Every runner splits its load evenly between the two, so network and timing differences do not skew the result. At the end Spitfire shows the difference step by step and says it plainly: better, no difference, or worse.
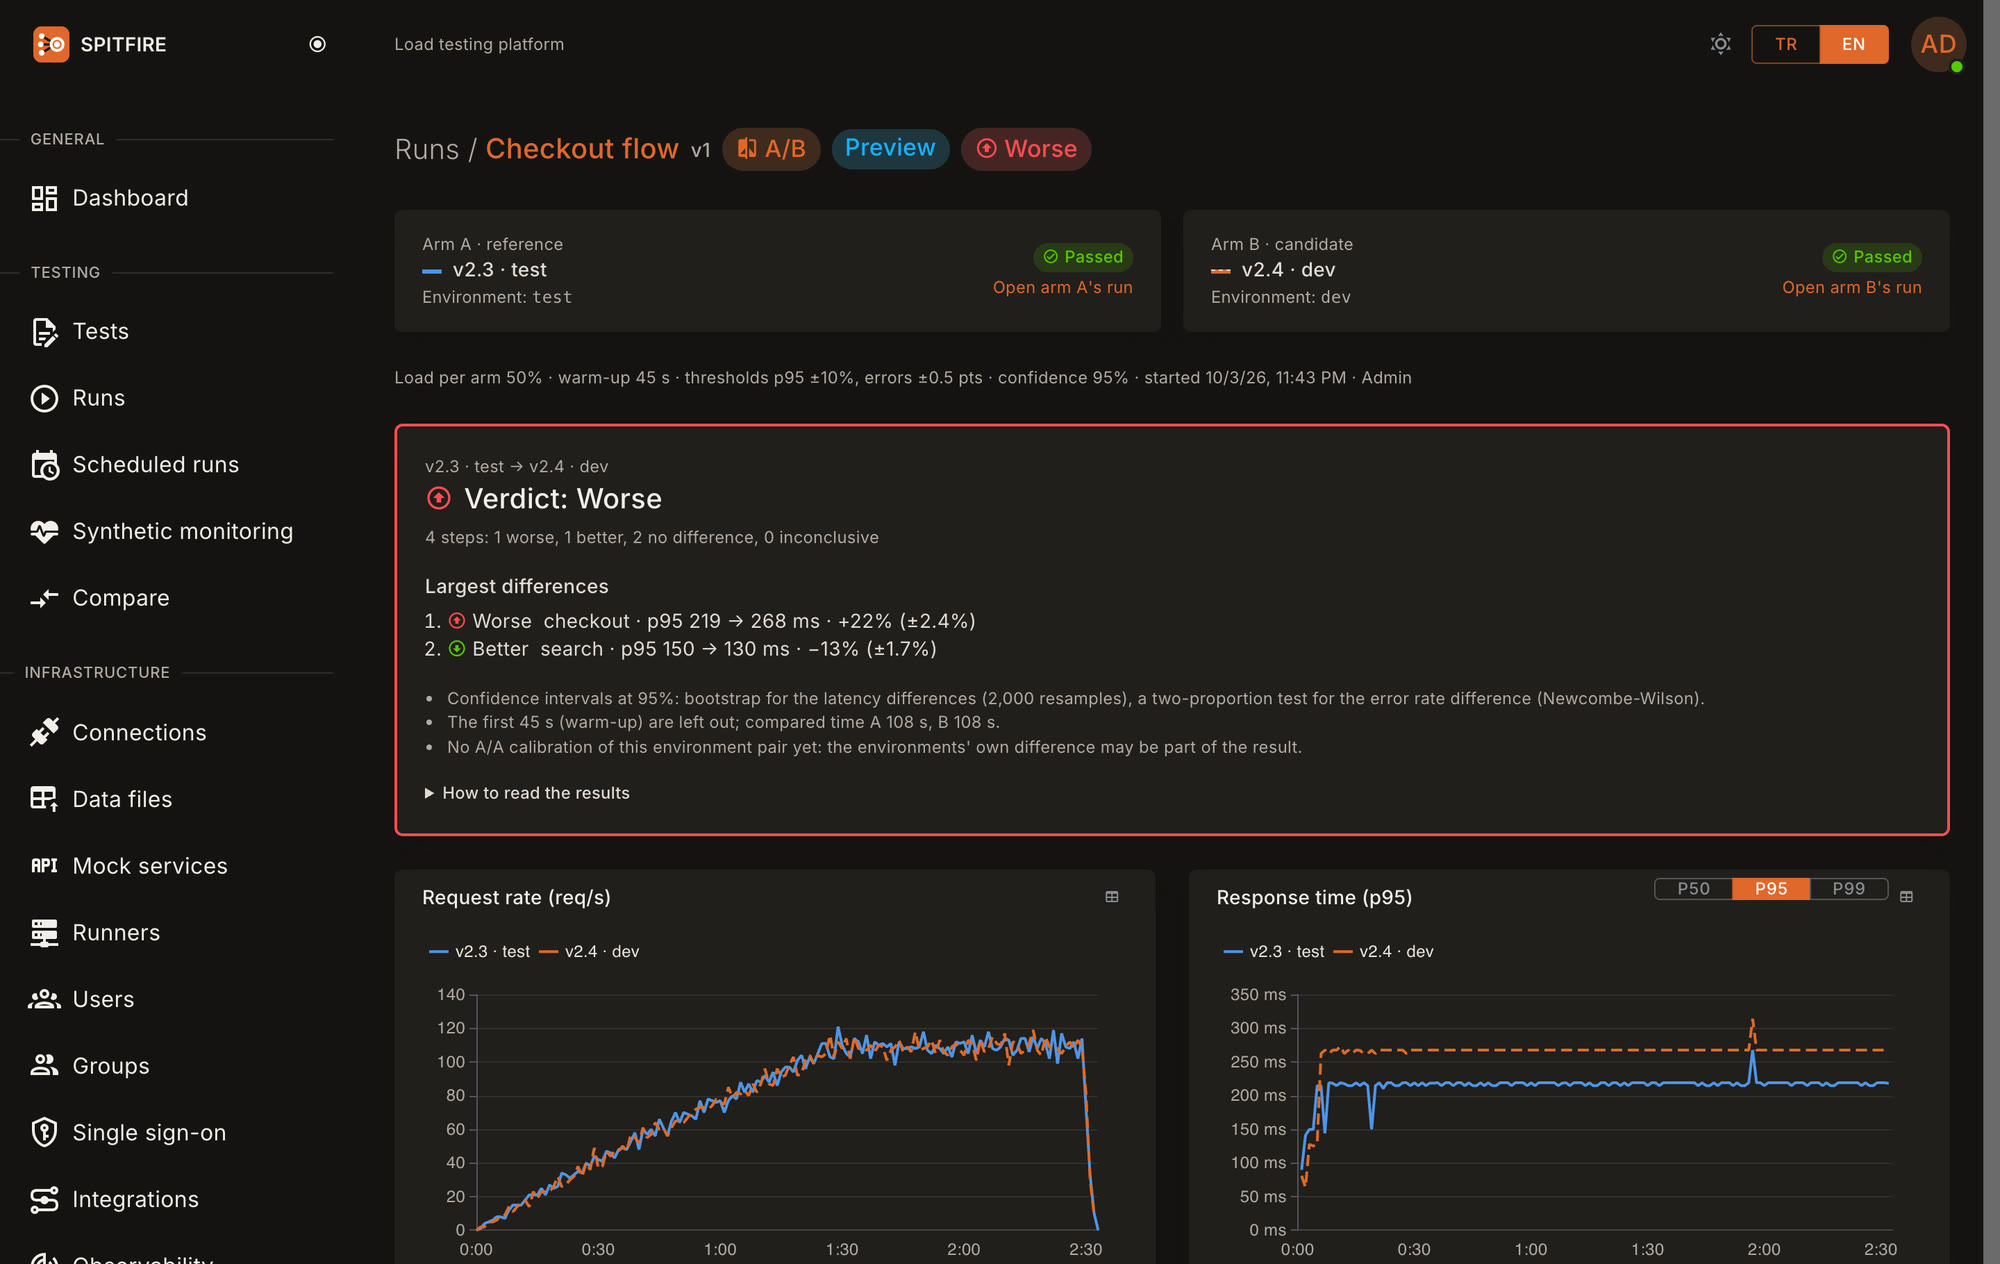
Like for like
Before it starts it compares the two environments, and warns when they share a database or sit at different network distances.
Takes out the environment difference
A calibration run with the same release on both measures how the environments differ on their own; the result is corrected for it.
Release gate
In CI, a slower new release fails the step with exit 98, and the release does not go live.
What can it do?
Beyond HTTP, in the same test
A user journey calls the API, drops a message on a queue and queries the database. Spitfire loads all of them as steps of one test.
Reproduce the production query profile on the database: import pg_stat_statements or MySQL statistics, or a .sql file, and one SQL step runs up to 200 queries weighted by their call counts; each query's p95 and error rate are reported on their own. SQL query mix →
A realistic database load from your own schema, without writing a line of SQL: Spitfire reads the catalog and suggests queries built on primary keys, indexes and foreign keys, each checked with EXPLAIN. Your data does not leave your servers, and nothing is read before you consent. Databases behind a bastion are reached through an SSH tunnel whose host key is verified. Query suggestions from the schema → · SSH tunnel →
Kafka load testing → · gRPC load testing → · WebSocket and SSE load testing →One run, several cities.
Split the load across locations by percentage and see each location's latency separately. Remote runners connect outbound to the controller over TLS with key pinning, so the load servers need no inbound ports.
A runner installs as a Docker image or as a single binary with a systemd unit; the UI prepares the install command.
--ca-pin sha256:9f2c…e41a
What is in Spitfire?
| Feature | Spitfire |
|---|---|
| To write a test | Web editor or JSON |
| Single sign-on (OIDC, SAML, LDAP) | ✓ group → role mapping |
| Self-hosted team UI | ✓ roles, groups |
| SQL · Kafka · MQTT · Redis · MongoDB | ✓ built in |
| Several locations in one run | ✓ by percent |
| Tests from OpenAPI / Postman / HAR | ✓ in the UI, auto-correlation |
| Capacity (breaking point) test | ✓ stepped, states the capacity |
| Findings from a run | ✓ with its numbers, conservative |
| Production write guard | ✓ |
| Shareable report | ✓ PDF, HTML, link |
| Scheduled runs + Slack / Teams / e-mail | ✓ built in, PDF attached |
| Alert on a regression against the baseline | ✓ Slack, Teams, e-mail, SMS, webhook |
| Responses of failed requests | ✓ samples on the run page |
| Two releases compared at the same time | ✓ with a verdict and confidence intervals |
| Audit log | ✓ tamper-proof |
| Pass/fail exit code for CI | ✓ k6-compatible, on your runners |
Works by your organization's rules.
Spitfire runs on your infrastructure; identity, permissions and audit plug into your organization's processes.
Data stays in your network
The controller, database and runners run on your servers; test definitions and results are not sent out. The license is verified offline and works air-gapped.
Runners dial out
No inbound port on the load servers. The runner checks the controller's key against a SHA-256 pin, which protects against man-in-the-middle attacks.
Production write guard
SQL/MongoDB writes, dangerous Redis commands and data-changing HTTP requests are flagged; the test does not start until the person starting it sees the list and confirms. It asks again on every run.
Append-only audit log
Who did what, when and from where. A database trigger refuses updates and deletes; exports as CSV.
Encrypted secrets
Connection passwords, tokens and certificate keys are encrypted with AES-256-GCM in the database; the API never shows them again.
Database access by consent, least privilege
Query suggestions from the schema are for installation admins only; nothing is read until a consent is recorded: who, when, from where. A ready read-only user script is provided and only the catalog is read.
Read the full security statement → · Self-hosted load testing →
Single sign-on
Roles and groups are mapped from your identity provider. Password sign-in can be limited to admins; SSO users have no local password. On Enterprise, SCIM closes a leaver's access at once.
Roles and groups
Admins write the tests. Groups decide who sees which test and who may run it. Reports are shared with people without an account through a link valid for 1–90 days.
Audit log
Tests, connections, users, permissions, sign-ins, run start and stop, write confirmations, report shares. You set the retention period (at least 30 days). On Enterprise it streams live to a SIEM over syslog or a signed webhook.
Kubernetes or Docker
Installs with one command in your own data center, private cloud or AWS/Azure VPC; amd64 and arm64.
Multiple locations
Split a run's load across locations by percentage. Remote runners install with Docker or without it (systemd, Windows service) and dial out to the controller.


Your first test in three steps.
All you need is Docker (plus kubectl for Kubernetes). No Go or Node required.
Install
curl -fsSL https://spitfire.tr/install.sh | bash -s -- docker
Starts Postgres, the controller, the web UI and 2 runners.
Create the admin
Setup code: K7QM-2XRT-9WHPOpen the address printed at the end and create the first admin with the one-time setup code.
Add a test, press Run
Tests → New → Run
Have Swagger/OpenAPI or Postman? Tests → From API document. For another location, Runners → registration key; the command is ready there.
From load to verdict, in one place.
Tests, connections, runners and every run's result live in one interface. Your team looks at the same number.
Built-in OpenTelemetry: closer to the root causeNo agent: your systems' own traces, metrics and logs, aligned with the load stages. ↓Real user journeys
Log in, list, order. A value from one response becomes the next step's variable, and every response is checked.
Tests from your API docs, a browser recording, or k6/JMeter
Point it at an OpenAPI 3, Swagger 2.0 or Postman collection, or a HAR file recorded in the browser; the requests you pick become steps. In a recording, tokens and ids a response returned and a later request sent back become variables automatically, and pauses become think time. Methods that change data need a separate approval. Existing k6 scripts and JMeter plans become tests with Open file.
Load tests from OpenAPI and Postman → · Moving from JMeter → · Moving from k6 →Realistic data and sessions
Upload a CSV and every iteration takes a row: in order, at random, or unique across runners. Each virtual user keeps its own cookies, so logged-in web flows work without passing headers by hand.
Load from several cities
Split a run across locations by percentage. Remote runners dial out over TLS with key pinning, so no inbound ports are needed.
Capacity and findings
"Find the breaking point" climbs the load in steps, judges each step on its own p95 and error rate, and states the rate at which the system misses the criteria. Every finished run draws findings from its own numbers: the slowest step, kinds of errors, throughput that stopped following the load, differences between locations, a regression against the baseline. A finding appears only when the effect is clear and shows its numbers; it never claims an internal cause it cannot see. With your systems' own data connected, it also writes what they measured (below).
Breakpoint testing guide →Built-in OpenTelemetry: closer to the root cause
Spitfire installs no agent on your systems. It reads the data they already produce: during the run your OpenTelemetry Collector also sends traces, metrics and error logs to Spitfire over OTLP; when the run ends, Spitfire queries Prometheus-compatible sources (Grafana Mimir, Thanos, VictoriaMetrics), Tempo or Jaeger, and Loki for the run's window. If you use another OpenTelemetry-based system, one more exporter on the Collector is all it takes.
All of it is aligned with the load stages. The run's Backend tab shows, stage by stage, which service and database slowed down, its slowest operation and its errors; the findings write it with the numbers and say so when data is missing. At the breaking point, the resources that jumped most are ranked. Resource series (CPU, memory, connection pool) are drawn over the run's charts.
The system broke at 560 VUs; at the same time the orders-db connection pool filled up and checkout pod CPU reached 97%.
Scheduled runs, instant news
Run a test every night or every weekday morning. When a threshold breaks, a run fails or a scheduled run does not start, Slack, Teams, SMS or e-mail hears about it; the e-mail carries the PDF report. When a run is clearly worse than its baseline run (p95, p99, error rate, requests/s), you hear before any threshold breaks: while the system slows down, before users notice. Only on problems and only for the tests you pick, if you like.
Sign in with the company identity
Single sign-on with Entra ID, Okta, Google, Keycloak (OpenID Connect), ADFS and other SAML 2.0 providers, or Active Directory / LDAP. Accounts open on first sign-in; the admin role and group memberships come from the identity provider's groups. If you like, password sign-in stays for admins only. On Enterprise, SCIM lets the identity provider create and deactivate users: a leaver's access ends at once.
A guard against production writes
SQL and MongoDB writes, dangerous Redis commands and HTTP requests that change data are flagged; the run does not start until the person starting it has seen the list and confirmed, and it asks again on every run. Passwords stay in an encrypted vault.
Live results, compared with history
Per-second charts with per-step and per-location breakdowns. Mark a baseline and regressions show side by side.
How to read p95 and p99 →Old release or new?
Run two releases on two equivalent environments at the same time with the same load. Spitfire shows the difference step by step and ends with a plain verdict: better, no difference, or worse. Details →
Not just "500": what the server said
The run page keeps samples of failed requests: a few per step and outcome, with the target, the error, the failed check, a few response headers and the first 2 KB of the body. Tokens in the address are masked, cookies are never kept, and steps that do not fail cost nothing.
Every save is a version
The test page lists versions, who saved them and the diff with the current one; an old version comes back as a new one in one click. When two people edit the same test, the second save warns instead of overwriting. Every run knows which version it ran.
APIs that want a client certificate
When internal or partner APIs are protected with mTLS and a private CA, put the certificate and key in the connection vault once; HTTP, WebSocket and SSE steps pick it. The key is stored encrypted and never enters the test definition; the Test button checks the certificate has not expired.
A report ready for your manager or customer
Every run becomes an HTML or PDF report in one click: charts, thresholds, steps, locations and the change against the baseline run. Send it to someone without an account through a time-limited, revocable link; raw data downloads as CSV.
A release gate in CI
GitHub Actions, GitLab CI or Jenkins run the saved test on the controller with an API token and pass or fail on its thresholds; the UI prepares the steps. The CLI also runs the same test file without a controller. Exit codes match k6.
Performance testing in CI/CD →Synthetic monitoring
The same scenario runs on production at low load, every 1 to 60 minutes: do sign-in, add to cart and checkout still work? The dashboard shows uptime and step duration trends; consecutive failures or a slow step send one alert to your channels, and a "recovered" message when it is back.
Synthetic monitoring →Performance diff on every PR
The test run in CI compares itself with the reference run and posts the result as a pull or merge request comment: p95, p99 and error rate per step. A breached per-endpoint performance budget fails the pipeline; the test page charts the p95 trend of recent runs by version.
Mock services and Turkish test data
Keep the load test off the real payment, SMS or cargo provider: mock services answer with templated responses at the latency and error rate you set. Scenarios use synthetic Turkish ID numbers, IBANs, phones, cities and names that pass the checks but belong to no one.
Talks to your monitoring
Run events go out as signed webhooks, live metrics over OTLP and Prometheus; your monitoring sees the load test on its own charts.
Built for teams
Admin and user roles; groups grant run rights per test. The audit log keeps who did what and when, tamper-proof and exportable to CSV; on Enterprise it streams live to a SIEM over syslog or a signed webhook. The interface speaks Turkish and English.
Start free
Every testing feature and protocol is open in every edition. Team and organisation features (SSO, audit log, multiple runners) are in the paid plans. Growth and Scale come yearly, as a monthly subscription or as a one-time month. On the yearly and one-time monthly plans the payment is taken once and the license does not renew itself. The monthly subscription renews automatically every month from your card; you cancel whenever you like. License keys are verified offline; your test data and results never leave your servers.
No extra charges for test time, virtual-user hours or metric volume: you generate the load on your own servers, and the license price is fixed.
Free
- Active users1
- Runs at a time1
- Concurrent virtual users100
- Requests / second500
- Run length15 min
- Browser VUs (Web Vitals)1
- Runners · locations per run1 · 1
- Per-second results kept7 days
- Scheduled tests1
- Notification channels1
- Synthetic monitors1 · every 15 min at most
- SSO · LDAP · audit log—
- Version comparison1 a month
- Performance budgets · PR comments1 test · 1 repository
- PDF / shared report“Free” mark
- SupportCommunity
Growth
billed yearly: $1,900 (taxes included)
Yearly: paid once, the license does not renew itself
- price lockRenew with your current key in the last 30 days before the end and the new year costs what you first paid, or the list price if it went down. It covers one period.
- synthetic monitoringYour scenario runs on production at low load every 1–60 minutes and alerts when it breaks or slows down. Yearly: 10 monitors on Growth, 30 on Scale; other plans 1 monitor, every 15 minutes at most.
- PR commentsThe CI run is compared with the baseline run and posted as a pull/merge request comment; a breached per-endpoint performance budget fails the pipeline. Unlimited on yearly plans; 1 test and 1 repository on the others and the free edition.
- add-on packsRaise the limits without changing plan: +5 users, +2,000 virtual users (+10,000 requests/s), +4 hours of run length, +5 runners · +2 locations.
- Active users5
- Runs at a time1
- Concurrent virtual users2,000
- Requests / second10,000
- Run length4 h
- Browser VUs (Web Vitals)5
- Runners · locations per run10 · 3
- Per-second results keptunlimited
- Scheduled testsunlimited
- Notification channelsunlimited
- Synthetic monitors10
- SSO · LDAP · audit log✓
- Version comparison✓ · CI and schedules on yearly
- Performance budgets · PR commentsunlimited
- PDF / shared reportunbranded
- SupportE-mail support, answered within 2 business days
Scale
billed yearly: $4,900 (taxes included)
Yearly: paid once, the license does not renew itself
- price lockRenew with your current key in the last 30 days before the end and the new year costs what you first paid, or the list price if it went down. It covers one period.
- synthetic monitoringYour scenario runs on production at low load every 1–60 minutes and alerts when it breaks or slows down. Yearly: 10 monitors on Growth, 30 on Scale; other plans 1 monitor, every 15 minutes at most.
- PR commentsThe CI run is compared with the baseline run and posted as a pull/merge request comment; a breached per-endpoint performance budget fails the pipeline. Unlimited on yearly plans; 1 test and 1 repository on the others and the free edition.
- add-on packsRaise the limits without changing plan: +5 users, +2,000 virtual users (+10,000 requests/s), +4 hours of run length, +5 runners · +2 locations.
- Active users15
- Runs at a time3
- Concurrent virtual users10,000
- Requests / second50,000
- Run length8 h
- Browser VUs (Web Vitals)20
- Runners · locations per run30 · 6
- Per-second results keptunlimited
- Scheduled testsunlimited
- Notification channelsunlimited
- Synthetic monitors30
- SSO · LDAP · audit log✓
- Version comparison✓ · CI and schedules on yearly
- Performance budgets · PR commentsunlimited
- PDF / shared reportunbranded
- SupportE-mail support, answered within 1 business day
Enterprise
Priced for your scale and number of installations
- Active usersunlimited
- Runs at a timeunlimited
- Concurrent virtual usersunlimited
- Requests / secondunlimited
- Run lengthunlimited
- Browser VUs (Web Vitals)unlimited
- Runners · locations per rununlimited
- Per-second results keptunlimited
- Scheduled testsunlimited
- Notification channelsunlimited
- Synthetic monitorsunlimited
- SSO · LDAP · audit log✓
- Version comparison✓ + CI and schedules
- Performance budgets · PR commentsunlimited
- PDF / shared reportunbranded
- SupportPriority support, answered within 1 business day
1 production + 1 test installation (same legal entity) · support by e-mail, weekdays 09:00–18:00 (Istanbul time); 1 business day is the time to a first response, not to a fix · 10–15% off for several years
Request a quoteOn the yearly and one-time plans the term starts the day you first enter the key. When you upgrade, what you paid is taken off. Project pass and Quarter licenses bought before remain valid for their term.
Frequently asked
Is my test data sent anywhere?
Do I need to write code?
Can I bring my k6 or JMeter tests?
How much load can my system take?
Can I run the same test against staging and production?
Can I test live screens that use WebSocket or Server-Sent Events?
What if a runner or the controller drops during a run?
Can I run a fixed number of operations instead of a duration?
I have a Swagger document, a Postman collection or a browser recording. Do I write the test from scratch?
Our monitoring alarms during load tests. What can we do?
Can people sign in with their company account (Entra ID, Okta, Active Directory)?
Can a test run every night and tell us when something is wrong?
How do I send results outside the team?
How do I run tests from my CI/CD pipeline?
SPITFIRE_TOKEN secret, and run spitfire cloud run "Test name" in a step. The CLI comes from the controller or the Docker image; the CI button on a test's page prepares GitHub Actions and GitLab CI steps. The step exits 0 (passed) or 99 (thresholds failed).Where can I install it?
I lost the setup code shown after installation. What now?
SPITFIRE_SETUP_CODE in ~/spitfire/deploy/docker/.env on Docker, the spitfire-secrets Secret on Kubernetes. The controller log also prints setup_code=, and re-running the installer shows the same code.Our API wants a client certificate (mTLS); can I test it?
How long are results kept?
What happens when the license expires?
How do I hear about new releases, and is updating hard?
How does the monthly subscription (Growth, Scale) work, and how do I cancel?
Is my card stored for the monthly subscription?
How do the monthly subscription's keys arrive?
When does the license term start?
What happens to what I paid when I upgrade?
Does the price change when I renew?
What is the price lock? What else comes with yearly?
If Growth's limits are not enough, must I move to Enterprise?
Can we pay by bank transfer or get a quote?
Which plan fits me?
What is the difference between the monthly subscription and the one-time month?
What does the free edition limit?
How do I know whether the new release is slower than the old one?
My two environments are not identical. Can I still trust the result?
Why not run twice and compare the two runs?
I have one test environment. Can I still use it?
Can CI stop the deployment when the new release is slower?
spitfire cloud run the --compare flag; if the new release is worse the step exits with 98 and the deployment stops.